Description
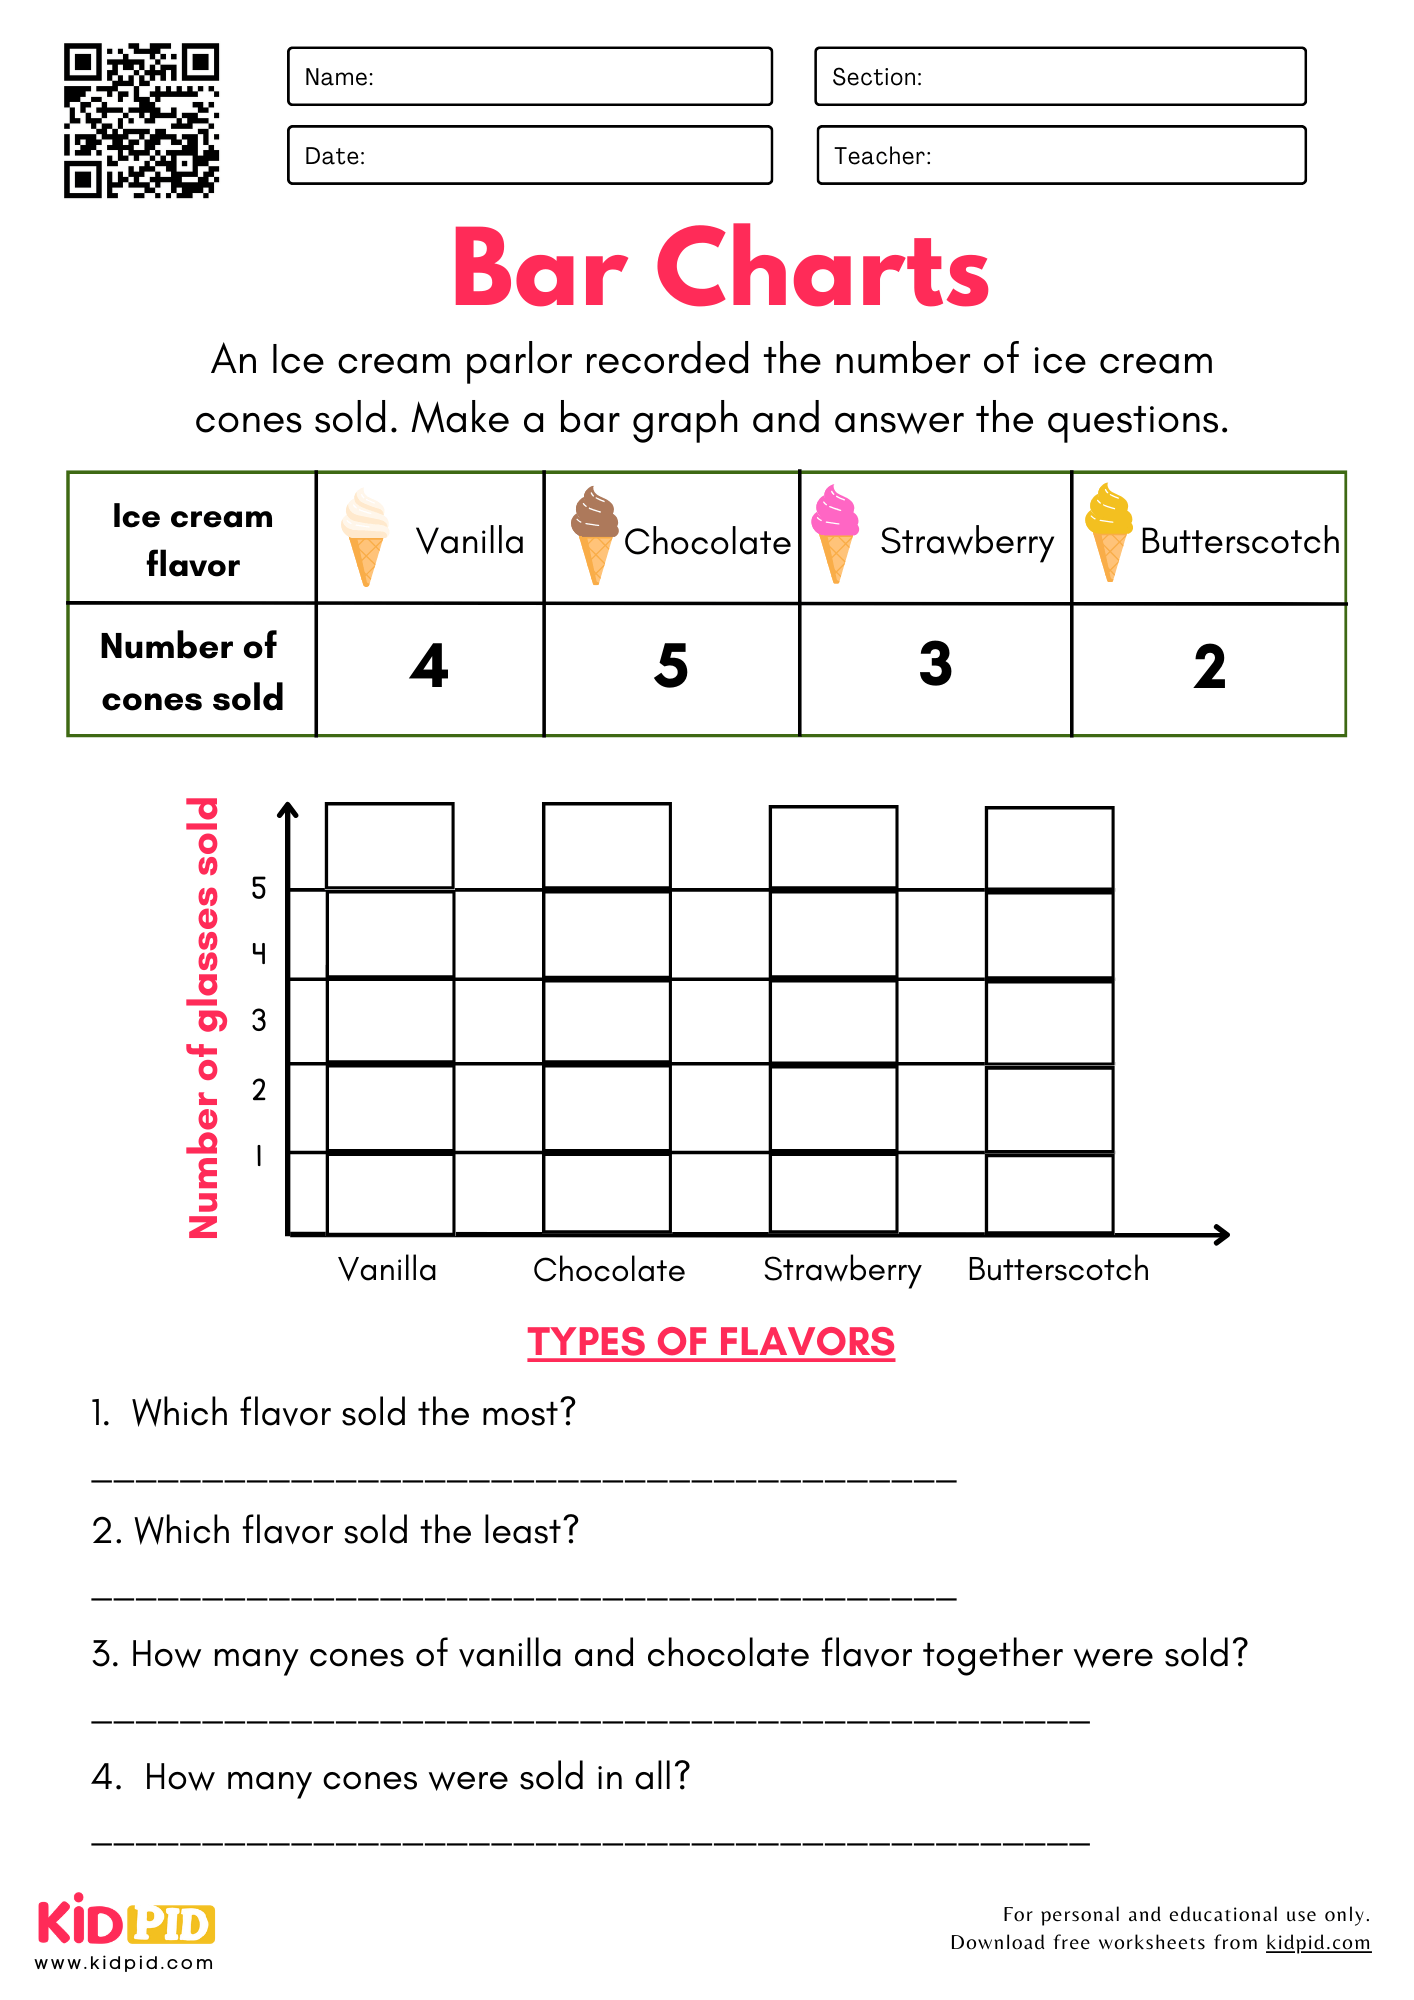
Come on, let’s learn math in a different and more fun way. Let’s solve the problem of an amazing topic bar chart with the help of ice cream cones.
We are introducing our new worksheet, especially designed for Grade 2 kids. This worksheet is part of the math subject.
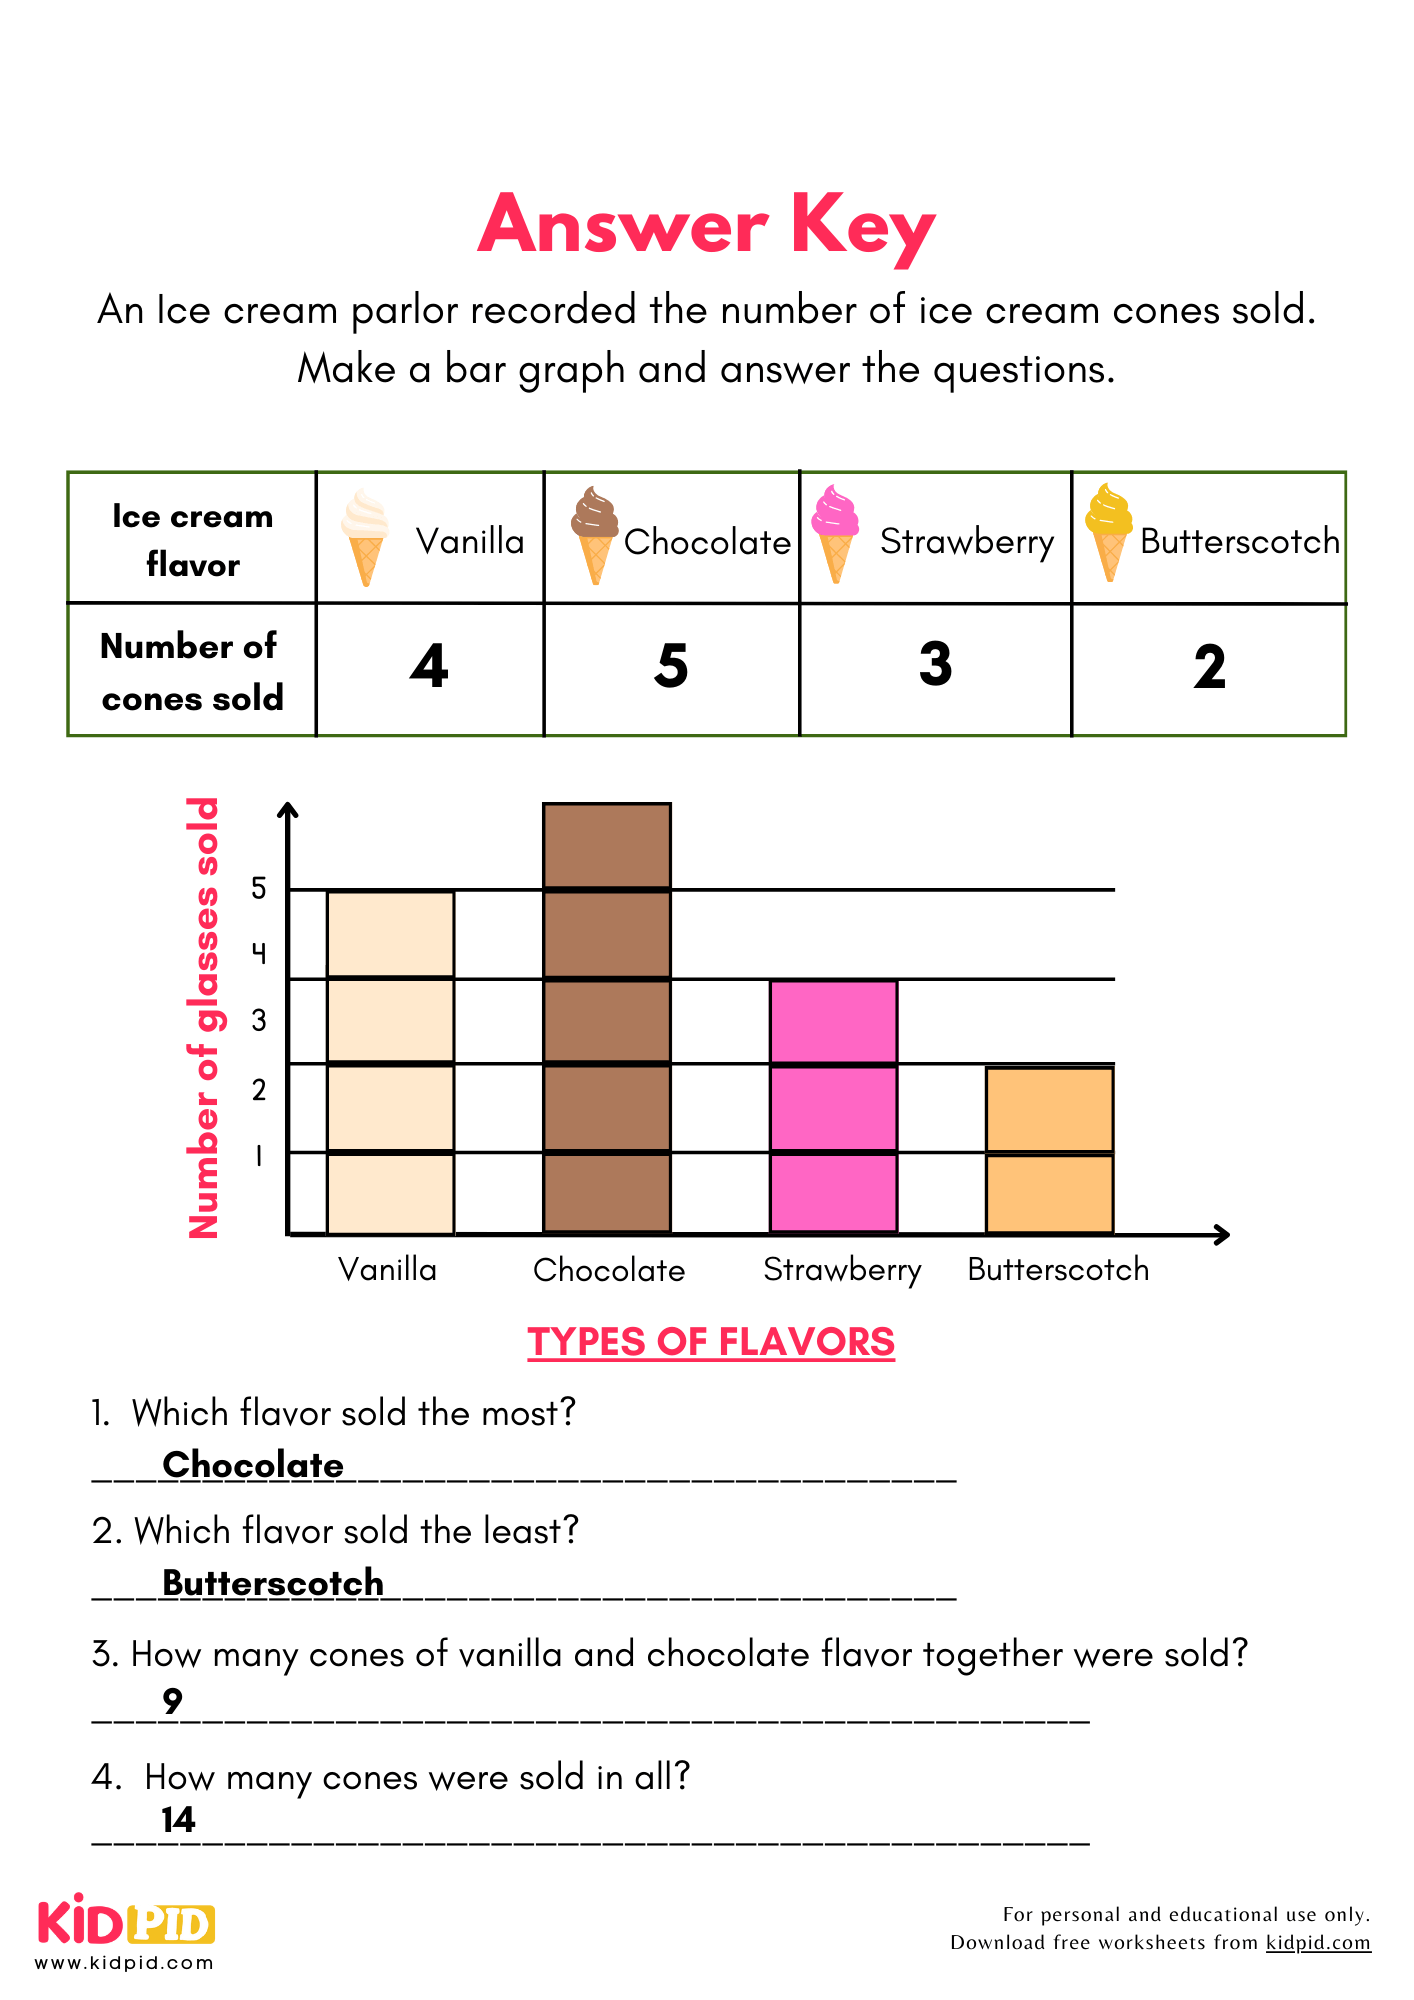
In this worksheet, kids will understand more about bar charts. Here in this worksheet, some data is given in which it is written how many cones of which ice cream have been sold. Based on this data, you need to color the box of the bar.
And based on this data, some questions are also given below the page. Kids need to answer the question after carefully examining the data and graph.
This will help them easily learn more about bar charts so that kids can learn without any difficulties.
Key Features of This Worksheet
- This worksheet is also available in PDF format. This is printable and can be used for many purposes.
- With the help of this worksheet, kids can also understand the idea of categorization.
- This worksheet will encourage their thinking as well as their math skills.
Teachers can use this worksheet for classroom activities, give children homework assignments, and have them practice for exams.
Kids can use this for extra revision as well as for more information regarding bar charts and graphs. Kids need to understand that graphs are also a very important topic in math.
Designed by our Content Team, this article aids understanding of core concepts.
Reviews
There are no reviews yet.