




Description
Make learning graphs exciting! Our Grade 2 worksheets teach tally marks, bar charts, and more through engaging, real-life scenarios. Download your printable pack today!
Turn Grade 2 Students into Data Detectives with these Data & Graphing Worksheets
Remember the last time your child tried to convince you that everyone in their class has a later bedtime? Or when they needed to figure out the fairest way to share a bag of marbles? That’s data in the making! In today’s world, understanding information is a superpower, and it starts right here in second grade.
Our downloadable worksheet pack isn’t just about filling in bars on a chart.
You will get these worksheets
- 4 Group Sort and Count Worksheets for Grade 2
- Tally Mark Worksheets For Grade 2
- 5+ Group Sort and Count Worksheet For Grade 2
- Analyze The Bar Chart Worksheet For Grade 2
- Create a Bar Chart & Analyze Worksheet For Grade 2
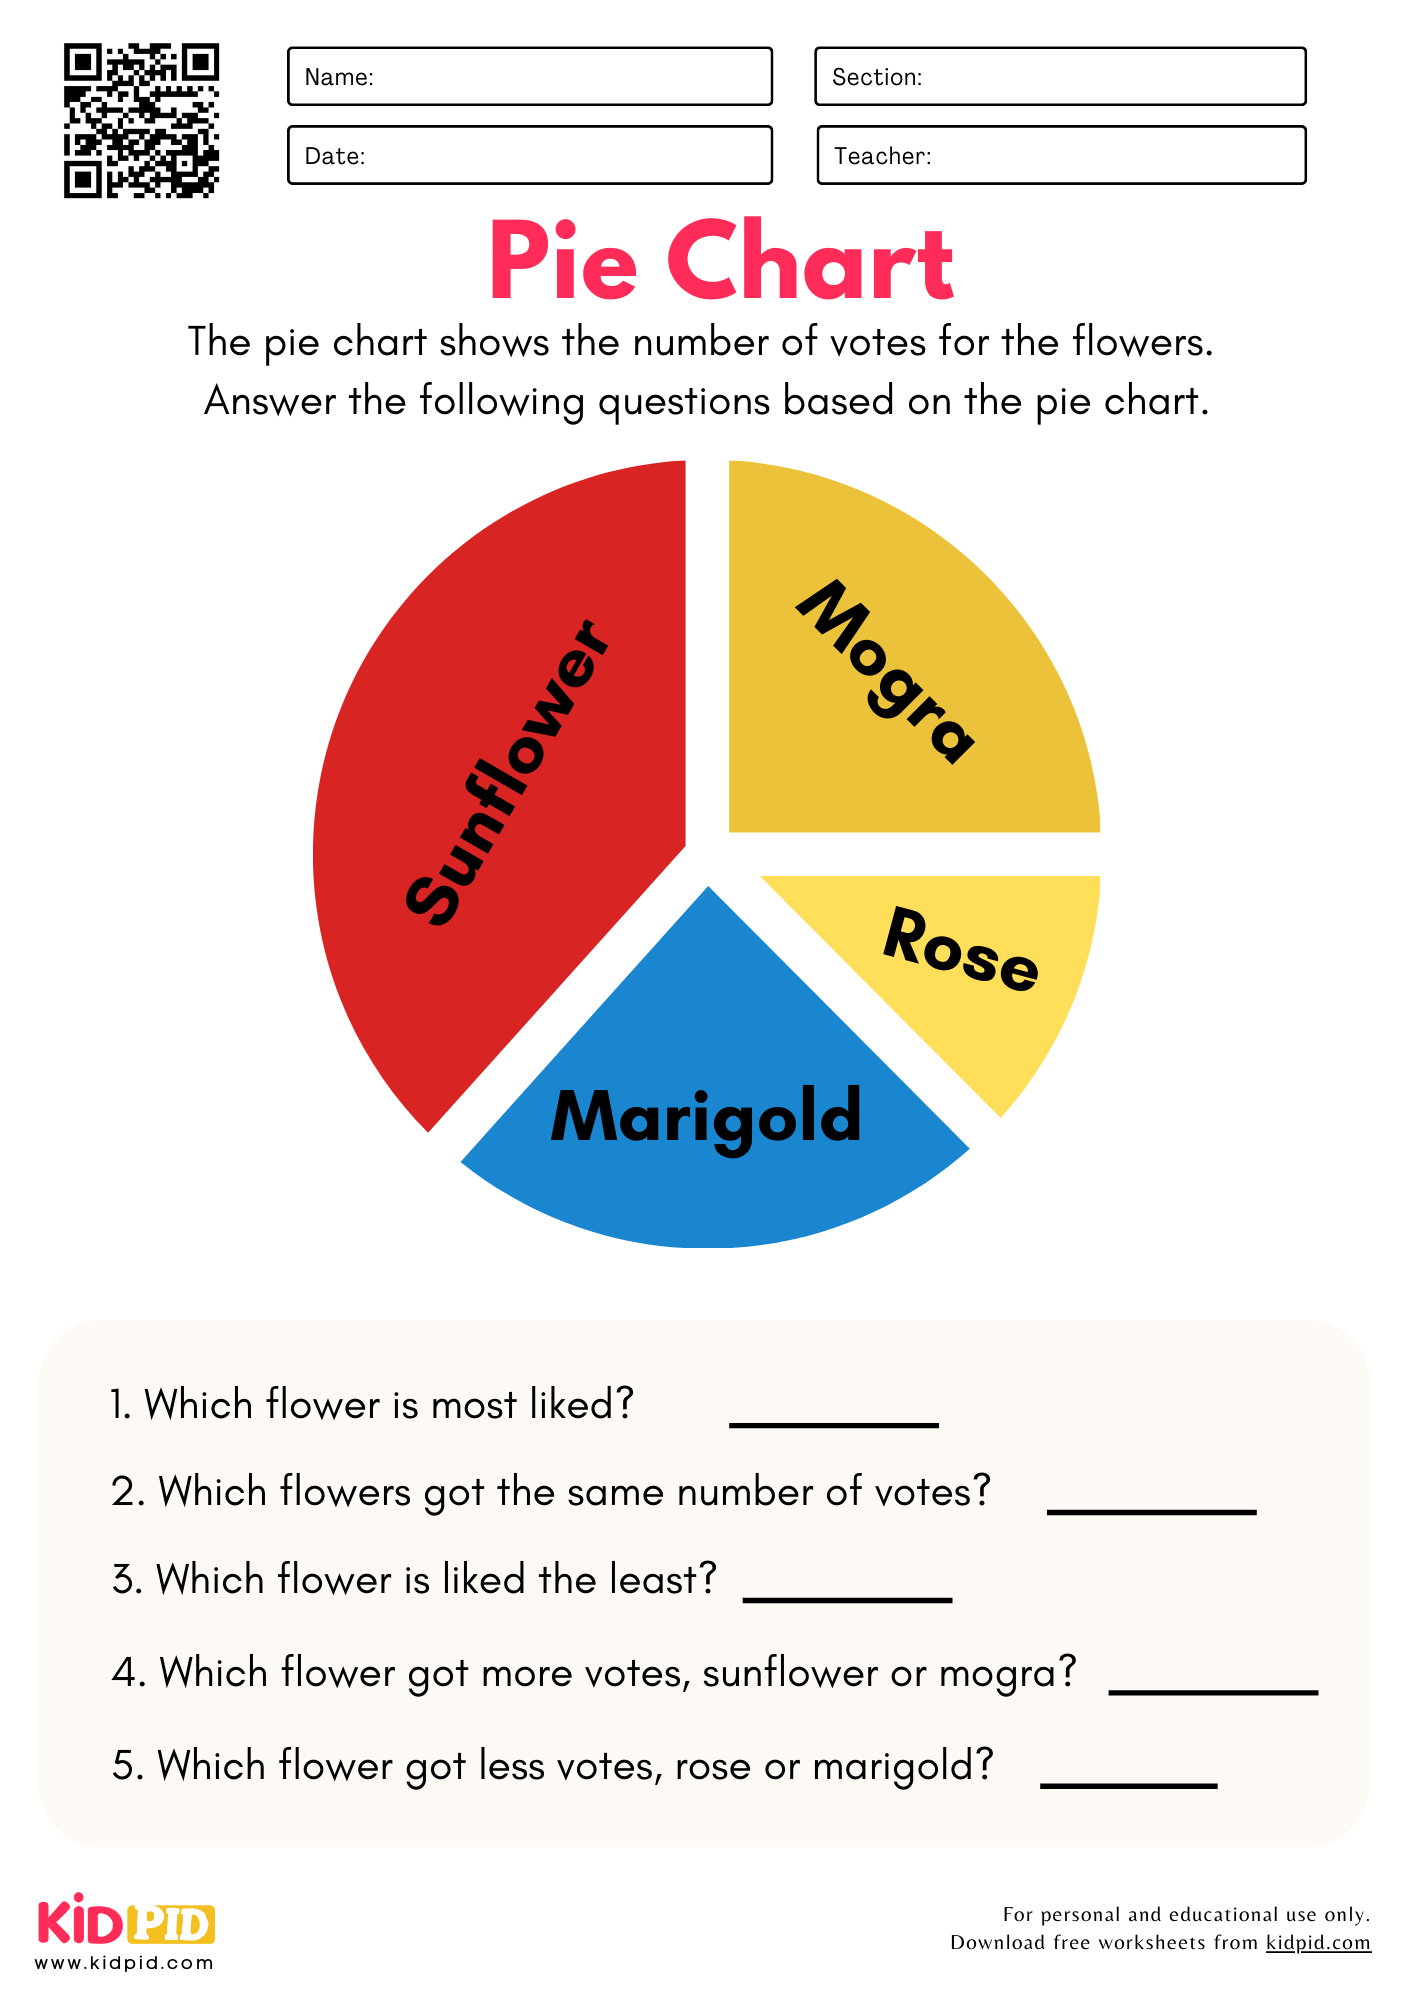
- Creating Pie Charts Worksheet For Grade 2
- Data Collection & Graphs Worksheet For Grade 2
- Draw Line Graph Worksheet For Grade 2
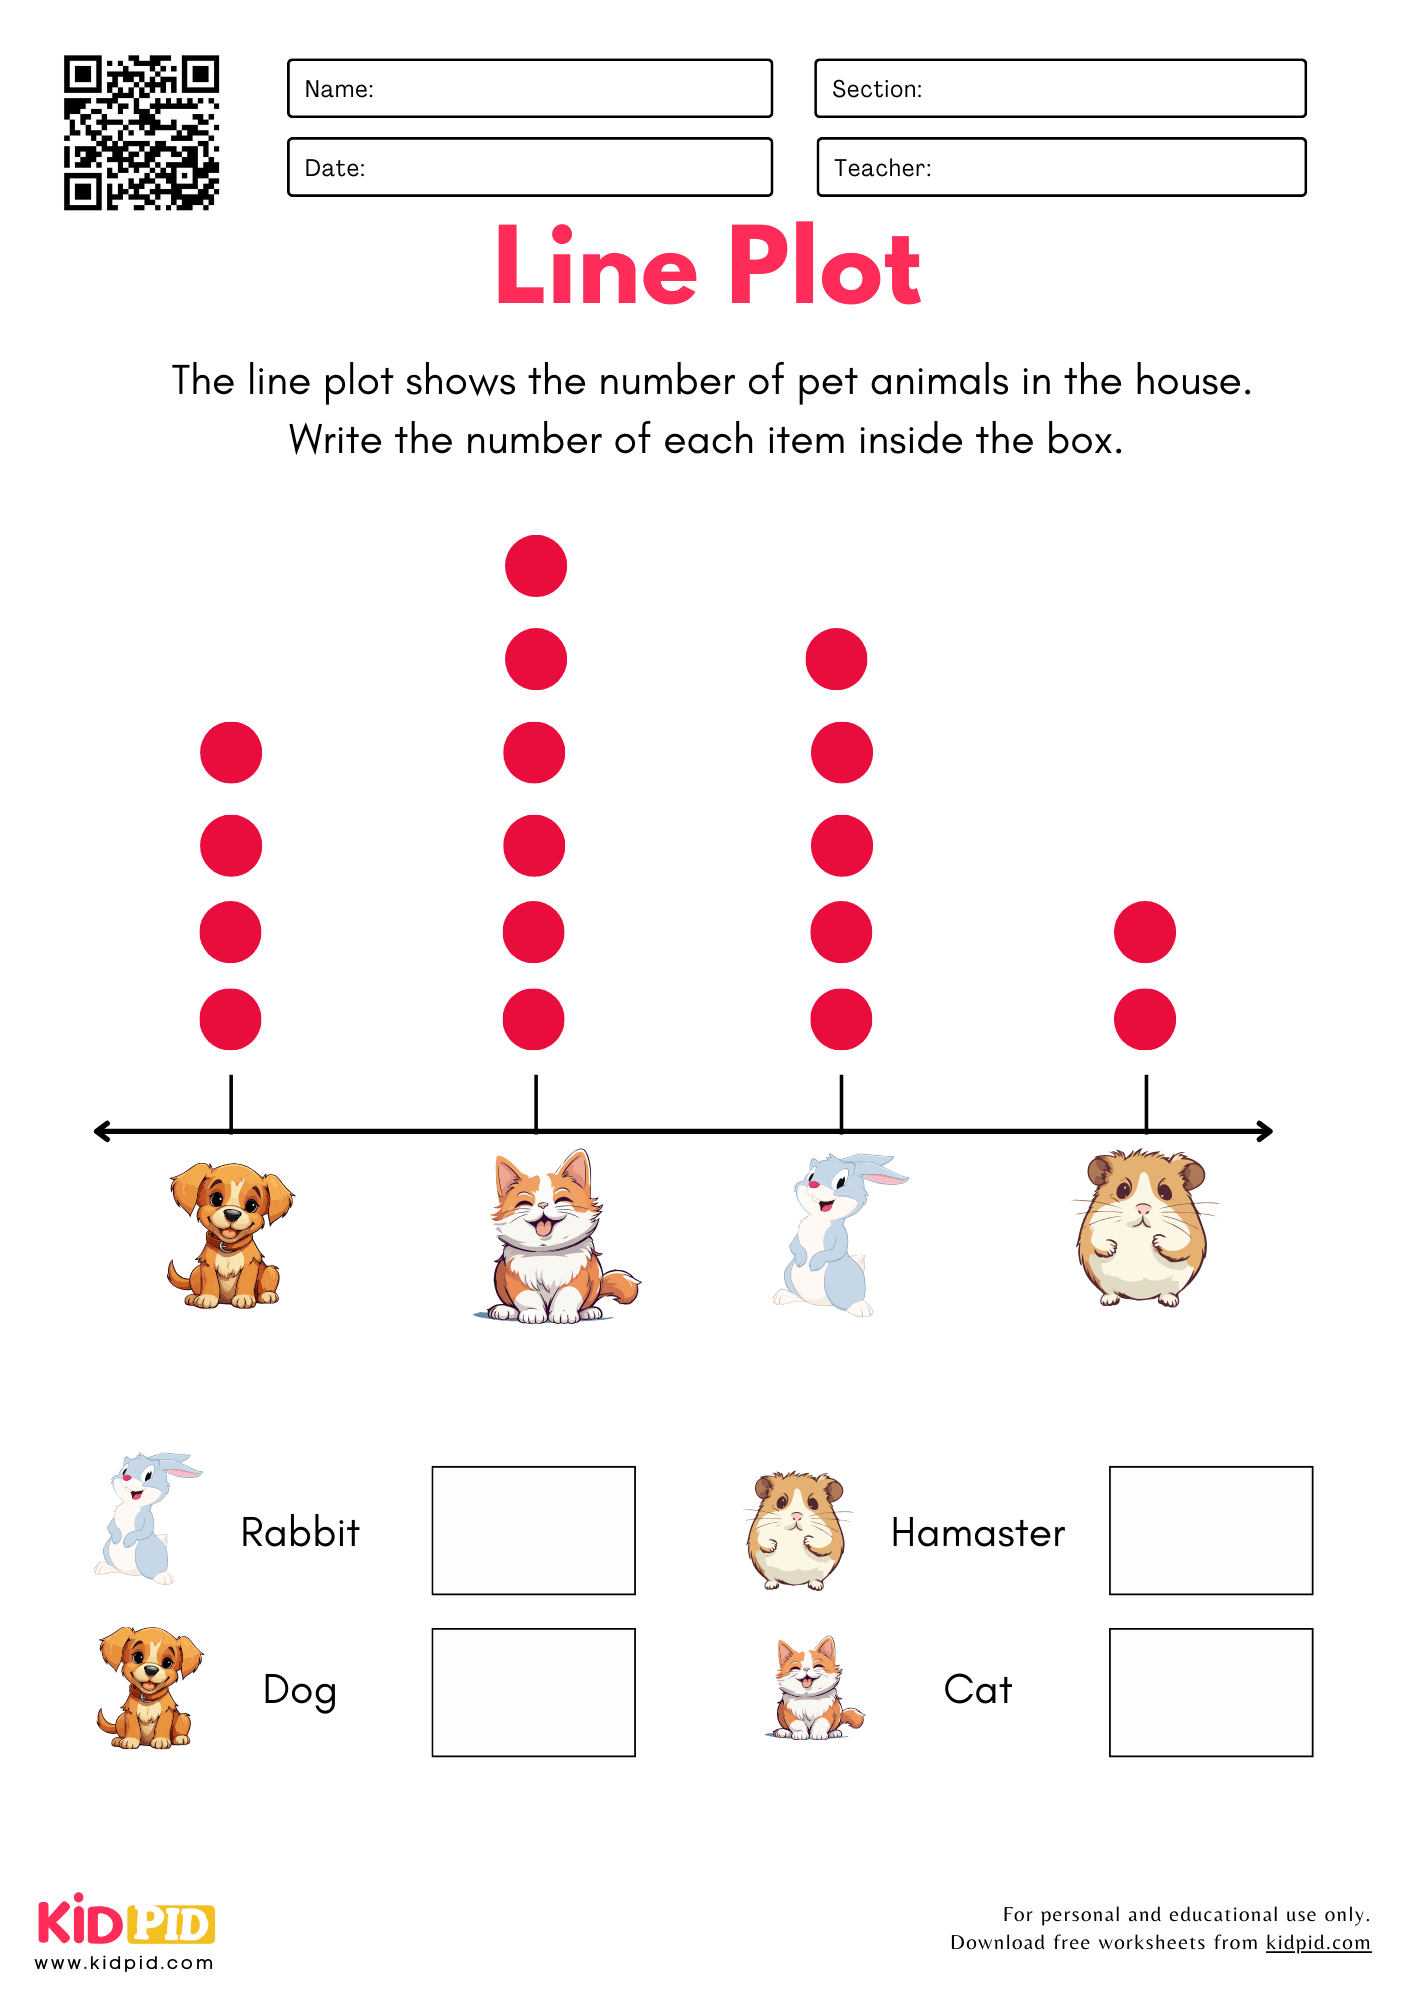
- Make the Line Plot Worksheet For Grade 2
- Making a Venn Diagram Worksheet For Grade 2
- Pictograph Worksheet For Grade 2
- Read the Line Graph Worksheet For Grade 2
- Read the Line Plot Worksheet For Grade 2
- Reading Pie Charts Worksheet For Grade 2
- Reading Venn Diagram Worksheet For Grade 2
Start with the Basics: Sorting and Counting
Before you can build a graph, you need to know what you’re counting. That’s where our Group Sort and Count Worksheets come in. We start simple with 4 groups and then ramp up the challenge with 5 or more groups.
- The Skill: Students learn to categorize items—by shape, color, or type—and then count each category carefully.
- Real-World Fun Activities: It’s just like sorting balls of different colors.
- Why It Matters: This is the essential first step. You can’t create accurate data if you haven’t sorted and counted correctly first.
Learn to Create Bar Charts, Pie Charts, and Line Plots
Our worksheets guide them through both creating and analyzing bar charts, pie charts, and line plots.
- Analyze the Bar Chart Worksheet: Here, students become data detectives.
- Create a Bar Chart & Analyze Worksheet: This is a key skill. We don’t just want them to read graphs; we want them to build them. This empowers them to present their own findings.
- A Note on Pie Charts: We introduce pie charts in a very simple way, using clear fractions like halves and quarters. It’s a fantastic introduction to the concept of parts of a whole.
Leveling Up: Venn Diagrams and Line Graphs
For students ready for a challenge, we include worksheets on Venn diagrams and line graphs.
- Making a Venn Diagram Worksheet: This is all about comparing. For example, what are the qualities of a good friend versus a good student? What do dogs and cats have in common, and what’s different? It’s brilliant for developing logical reasoning.
- Draw Line Graph / Read the Line Graph Worksheet: We introduce the idea of change over time in a simple way. “How did the height of our classroom plant change over four weeks?” This connects math directly to science observations.
The Complete Data Journey in One Pack
The beauty of this collection is its progression. It logically moves from sorting to recording to visualizing. The Data Collection & Graphs Worksheet is the capstone, often involving a hands-on survey where students ask their classmates a question and then represent the results.
Ready to explore the world of data? Download your complete set of Grade 2 Data and Graphing Worksheets now and watch your students’ confidence grow!
This article draws on expert insight from our Content Team to deliver trusted education.


Reviews
There are no reviews yet.