Description
Well, do you guys know that math holds an important topic called statistics, in which you will get a lot of subtopics?
These subtopics are different types of graphs in which data is given, and we need to analyze the data.
The data can be of any type.
One subtopic is a pie chart.
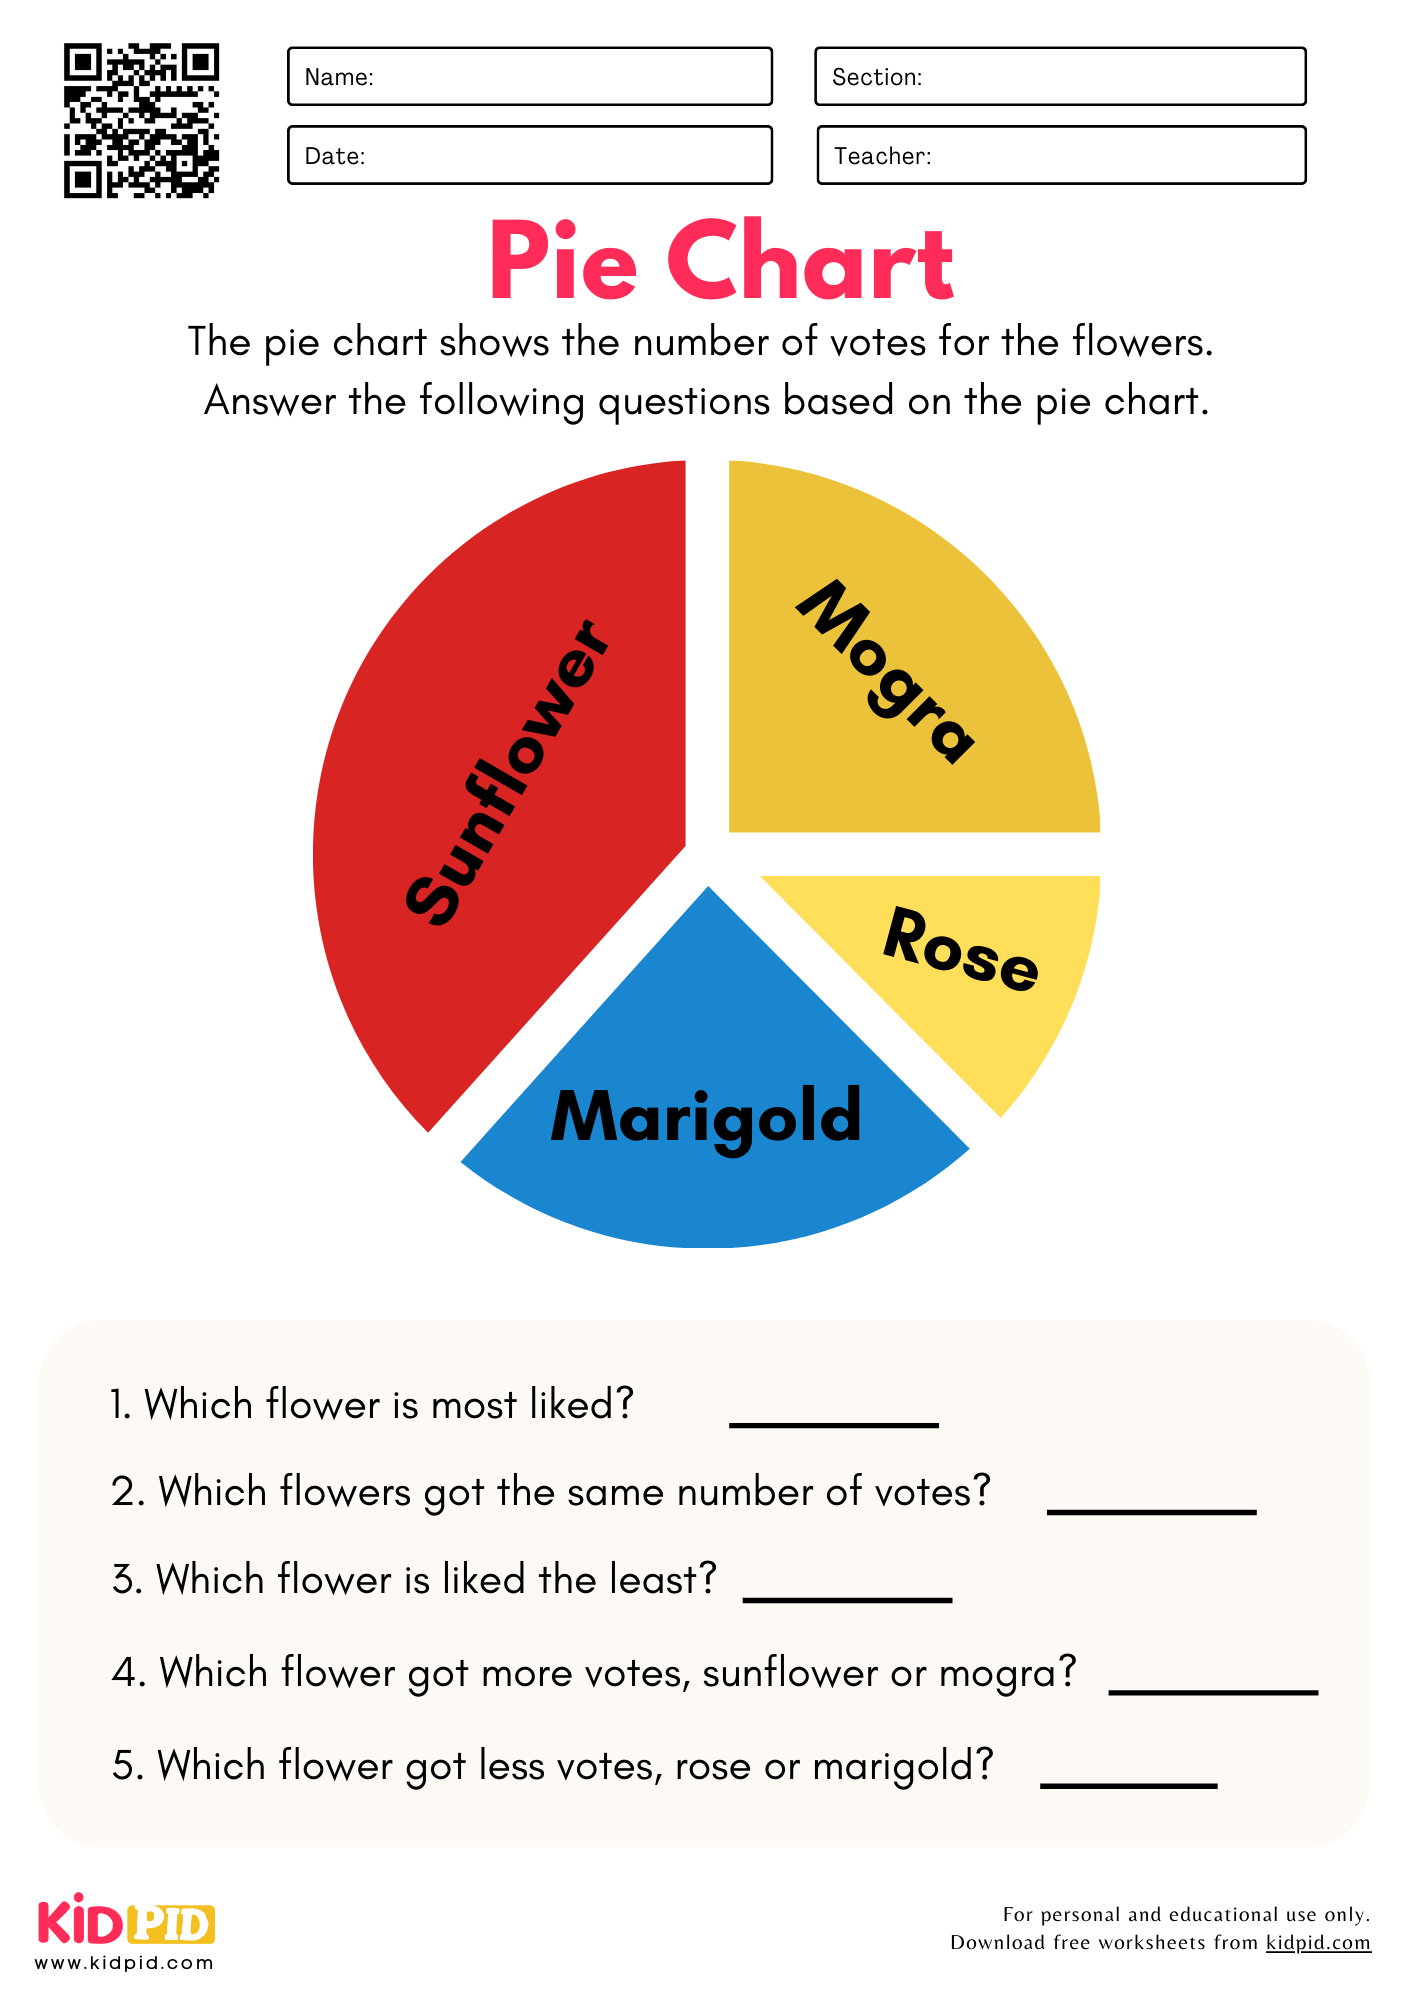
A pie chart represents data in percentages or fractions, where the entire circle = 100%.
Each slice of the circle shows which part is present and how much.
Let’s get ready to learn about it with the help of this worksheet.
Hello, sweet little ones
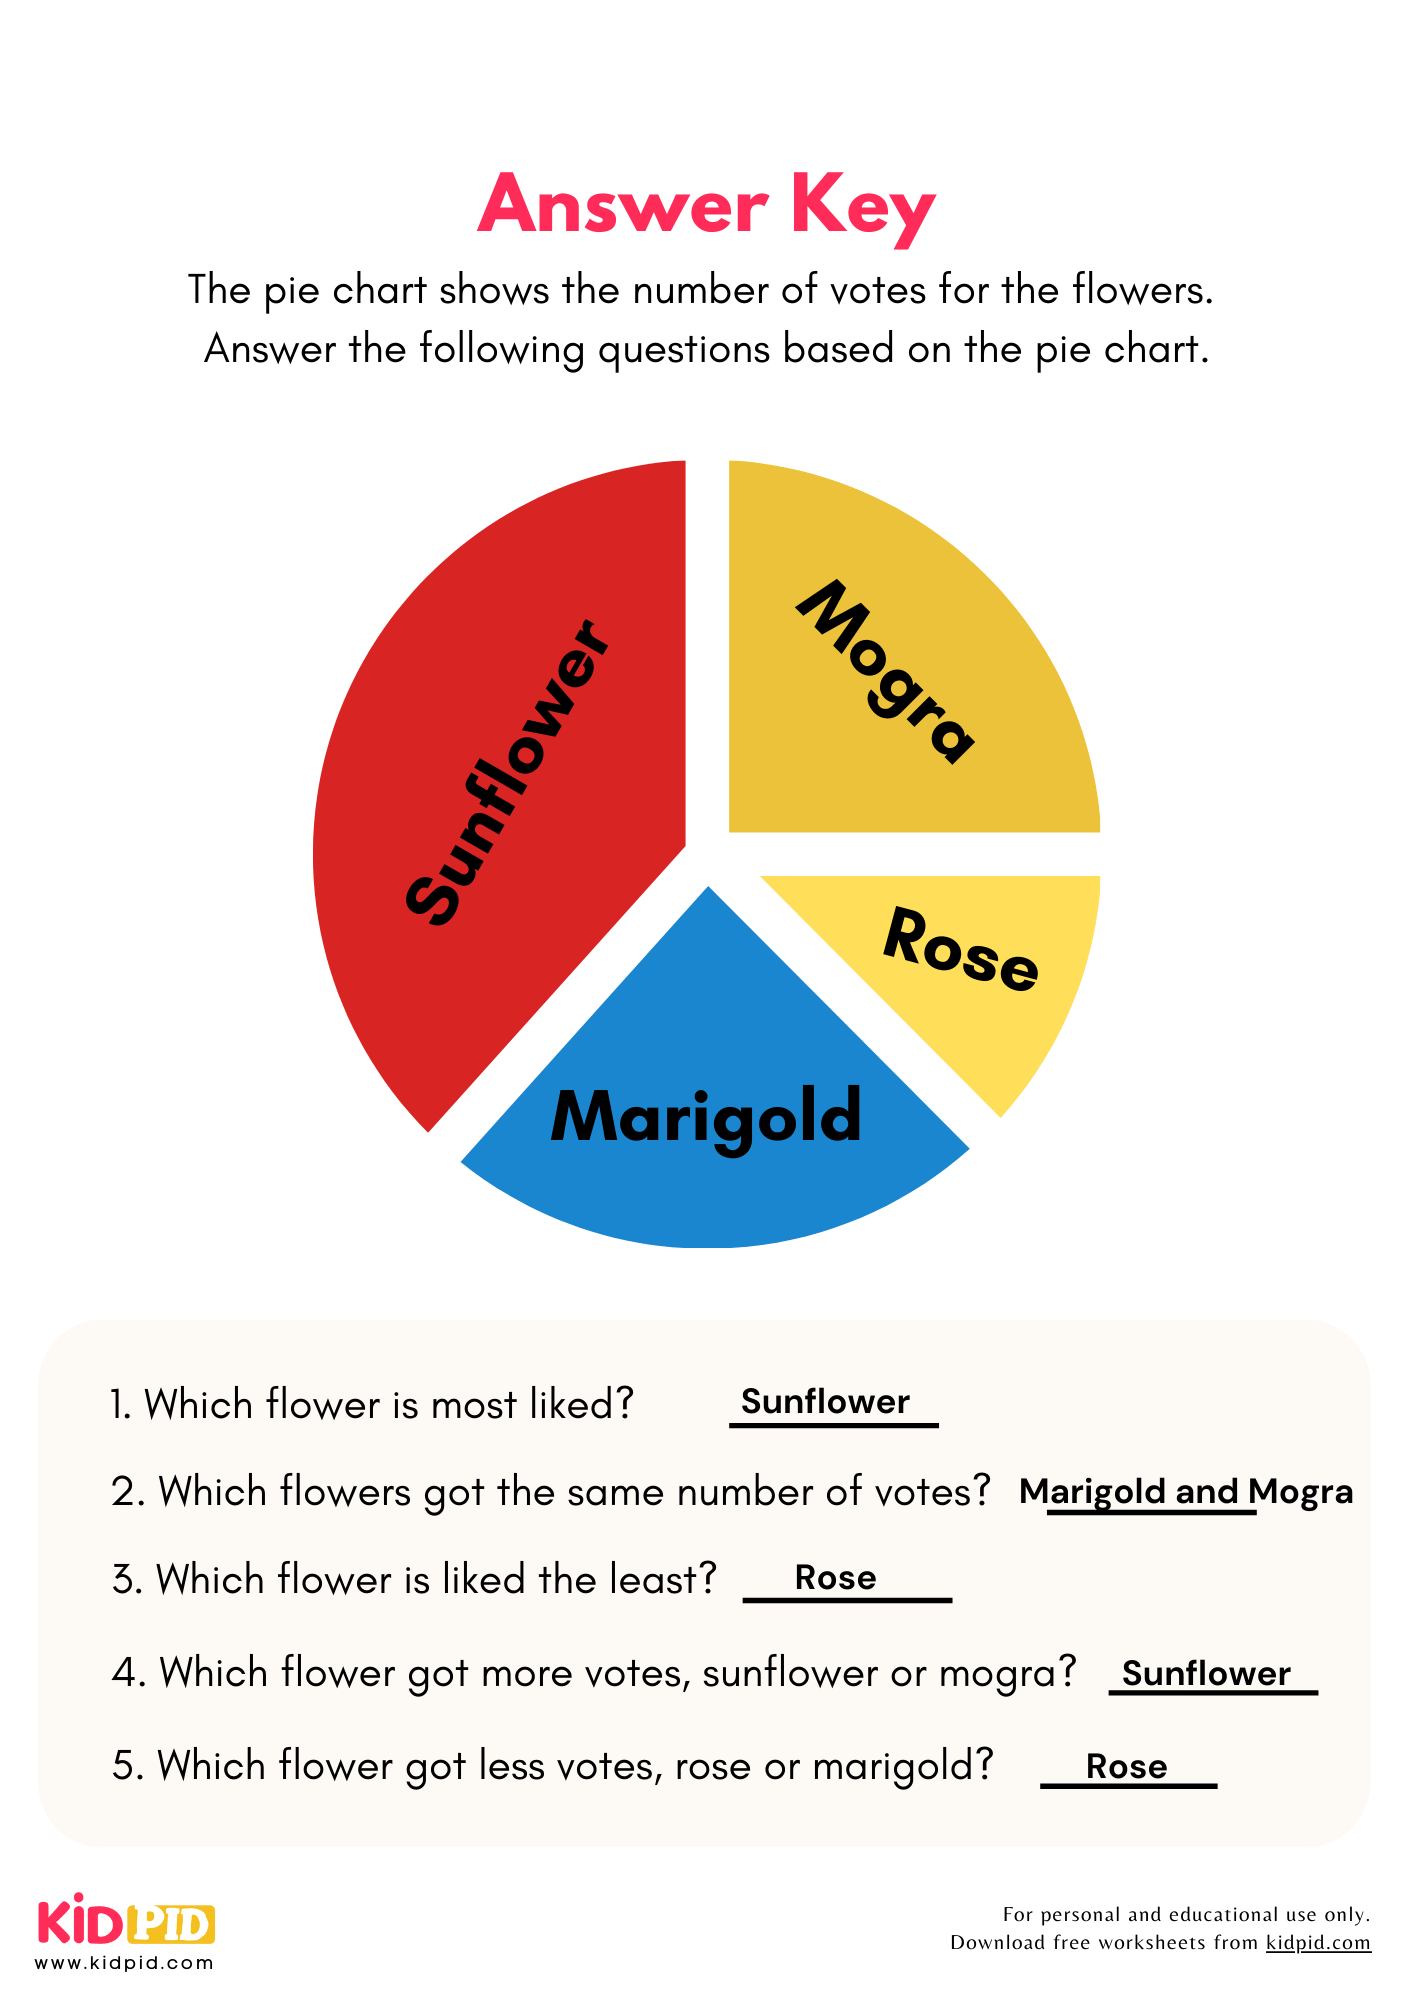
This time, we got a worksheet for Grade 2. This worksheet enables kids to learn more about statistics. This worksheet contains information about the number of votes for flowers. Which flower got how many votes? Based on these data, some questions are also asked.
You guys need to answer the question after carefully analyzing the data. The answer key for this worksheet is also provided, in which the answers to the questions are given. So that you guys can check the answer after doing this worksheet.
This worksheet will improve:
- Your observation and analysis skills
- Your thinking capacities
- Your reasoning skills.
Parents and teachers can also use this worksheet in many ways.
Teachers can use this as an extra assignment for kids so that they can learn something extra. Can give this as project work and can be asked to connect it to the real world.
Designed by our Content Team, this article improves conceptual clarity for learners.
Reviews
There are no reviews yet.